Steps to create beautiful graphs:
1. Define output file characteristics
- SET TERMINAL
[options] a) Display in terminal: WTX [ size 350,262 enhanced font 'Verdana,10' ] - size refers to X and Y which default are (640, 480) font refers to the font type and font size - b) Display in a png file: PNG [ nocrop enhanced medium size 350,262]
- c) Display in an svg file: SVG [ size 350,262 fname 'Verdana' fsize 10 ]
- d) Display in a ps file: POSTSCRIPT eps size 3.5,2.62 enhanced color font 'Helvetica,20' linewidth 2
- size is given in inch
- e) Create the image in a TEX file: EPSLATEX size 8.89cm,6.65cm color colortext
- create the plot with gnuplot; save it in graph.tex
- run $latex graph.tex
- run $dvips -o graph.ps graph.dvi
- SET OUTPUT '<file_name>'
NOTE: When working with output files, we need to set the name of the file where the graph will be saved
- SET LABELS NAME
- Sets the name of the axes and the points that should be display on the axes.
- set xlabel '{/Helvetica-Oblique <label_x_name>
}' set ylabel '{/Helvetica-Oblique <label_y_name> }' set xtics (value1, value2, value3, ...) NOTE: in for the EPSLATEX output set the xlabel and ylabel in latex notation: set xlabel '$x$' - SET BORDER linewidth <size>
- SET STYLE LINE <line_id> LINECOLOR rgb '#0060ad' LINETYPE <size> LINEWIDTH <size>
- SET TICS SCALE <size>
- SET XTICS ROTATE
- SET XRANGE [xmin : xmax]
- SET AUTOSCALE -- Let gnuplot determine the scale
- SET KEY-- allow legend to appear. Use "TITLE" in the using clause to customize the legend
- SET LABEL <label_value> AT x_value,y_value -- Set's a label on the point (x_value, y_value)
- NOTE: use UNSET label to return to the default values
- SET TERM POP --restores the terminal to the default value (usually X11 or WXT)
- SET OUTPUT --restores the output to default (terminal)
- PLOT 'path_to/file_name' USING 1:2 title 'Graph title'
- USING : states what are the values for the X axis (column 1) and values for the Y axis (column 2)
- If only one dimension is given (i.e.,values for y axis are known) then first number should be skipped (e.g., using :2). Values will be displayed as given and the Ox axis will contain the line number where y value is found.
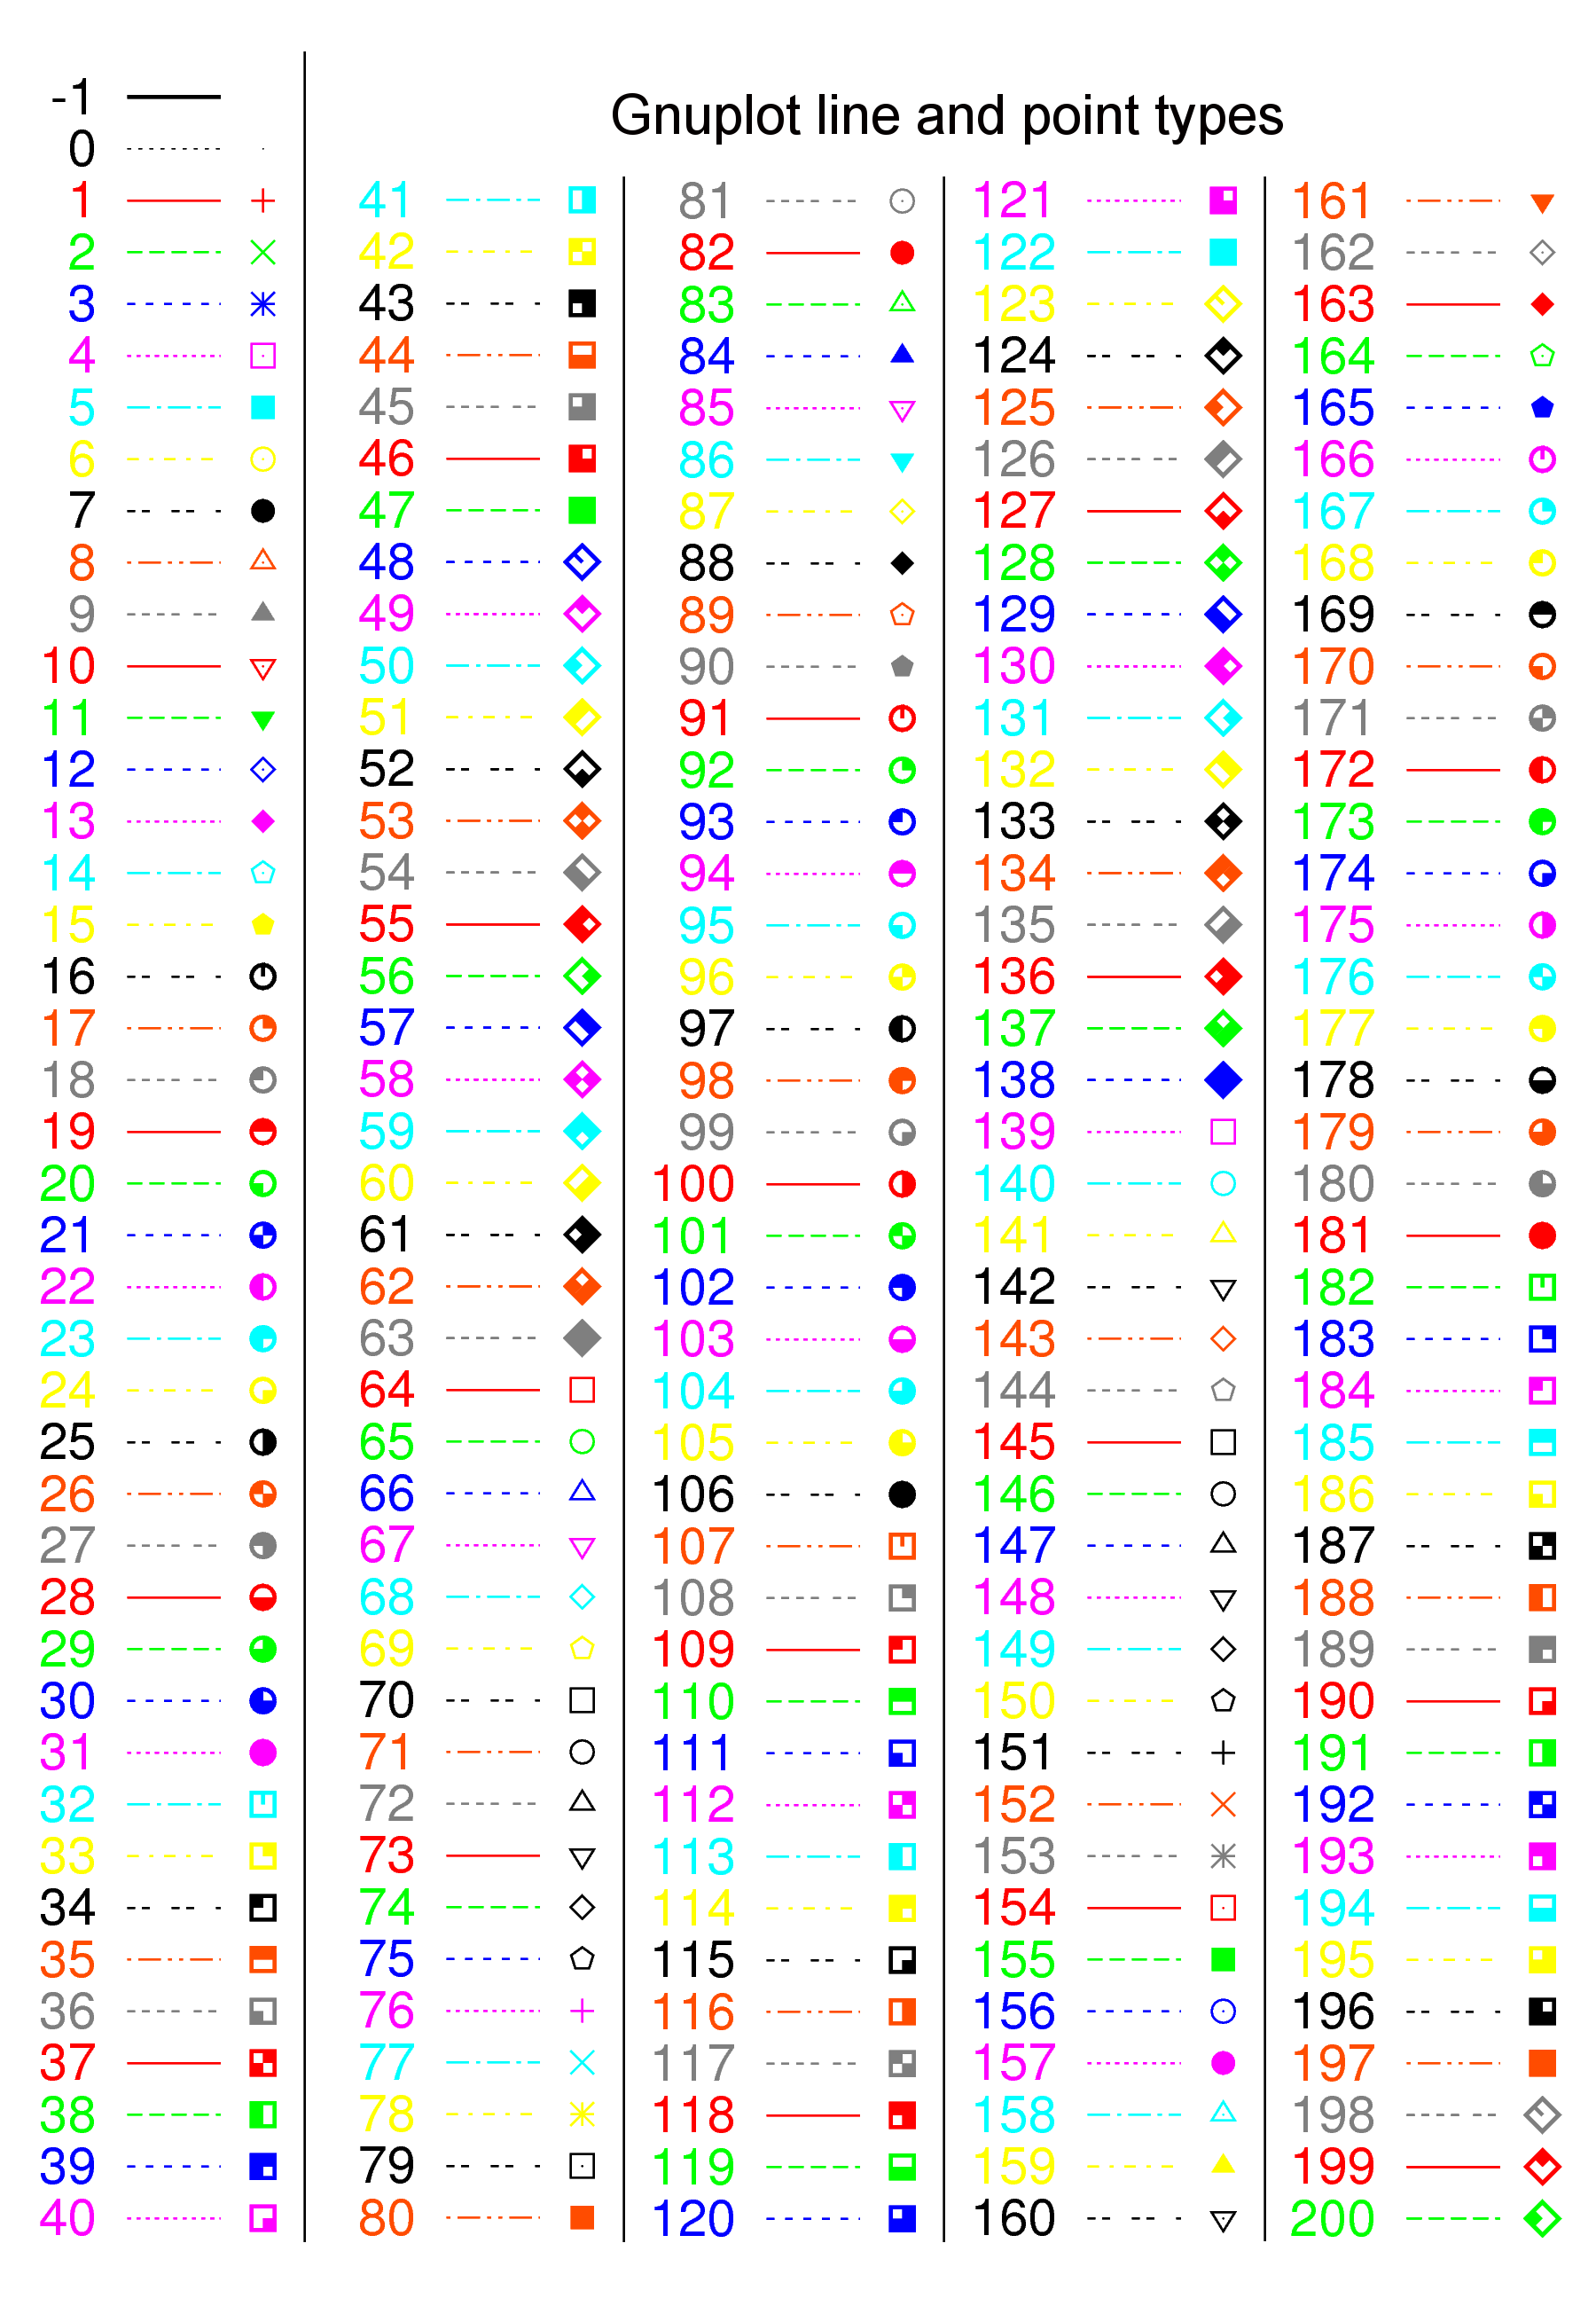
- pt <option1>--for point type
- use http://stelweb.asu.cas.cz/~nemeth/work/stuff/gnuplot/gnuplot-line-and-point-types.png for a reference to all possible point types (option1)
- ps <option2> --for point size (ex: using 1:2 pt 7 ps10)
- lc rgb 'color_name_or_code' --colors the line or the point with the color given
- use: http://html-color-codes.info/ to find color codes
- Conditional Plot: ($1==0 ? $2:1/0) <=> If (value in column 1 = 0) then plot value in column 2 Else do not plot anything.
*NOTE: good blogposts to read more about this:
--> http://people.duke.edu/~hpgavin/gnuplot.html
--> http://folk.uio.no/hpl/scripting/doc/gnuplot/Kawano/index-e.html
--> http://folk.uio.no/hpl/scripting/doc/gnuplot/Kawano/index-e.html
I really like your take on the issue. I now have a clear idea on what this matter is all about..
ReplyDeleteagario games